Feeds:
Posts
Comments

I wanted to keep writing but somehow did not continue doing(mainly due to laziness), I am planning to restart the blog writing by last quoting some of the interesting blogs that I read during the week.

Genetics/Genomics

outrage over DNA testing for UK asylum seekers(genetic future)

genomic history of breast cancer revealed(omics ! omics !)

Programming/computing

R Commander: A Basic statistics GUI for R(getting genetics done)

The informatics of new sequencing technologies(genetic future)

Twitter

Got introduce to Twitter very recently and only today I checked what it was. The main goal of twitter as they say on their website, is to easily keep contact with close friends. But for me Twitter has a completely different use. I have decided to use twitter to update my daily activities and see how I can get more productive.

Zotero

It is a tool that have using for managing my scientific reference papers. It is one of the best tools for that I have used so far. I have been using it for the last two months, still learning its features but I am really excited about the tool. I don’t have to print the paper and highlight the important points, file it away in the cabins and then start searching for it later. Oh what a relief !!. Thanks to the great folks of George Mason University’s Center for History and New Media for having produced such a software.

But the sad thing is that I need to maintain the same set of files on both my laptop and desktop as the reference material is stored in the hard disk. I cannot directly one from the other :(. But there are several new features being added to zotero to make it more powerful, so I am sure this will be taken into account.

All in all I feel Zotero is an essential tool for anyone doing research online.

Error bars

ResearchBlogging.org
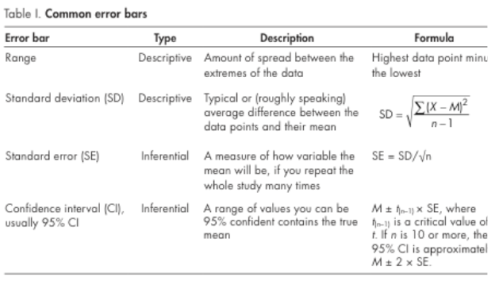
Error bars are almost shown in most of graphs used in research papers. In my experience not many of us give much importance to the error bars, questions about it only come from the group leader or the bosses. In several papers, the figure legends never describe kind of error bars used. Even in my statistics classes in biology the importance of error bars and their interpretation was never explained. Came across this nice paper in Journal of Cell Biology explaining usage of error bars in experimental biology.

They explain the different types of error bars used for descriptive and inferential statistics. The formulas are well explained and illustrated with good biological examples.

Cumming, G., Fidler, F., Vaux, D.L. (2007). Error bars in experimental biology. The Journal of Cell Biology, 177(1), 7-11. DOI: 10.1083/jcb.200611141

ResearchBlogging.org
The transcription or the expression of a gene(the process by which the DNA sequence is converted into a functional product like protein or RNA) is controlled by the region of the DNA generally present upstream of the gene. This region consists of several short segments(also known as motifs) which act as binding sites to proteins called transcription factors. It is generally believed that genes that share the same multiple regulators must show similar expression profiles or vice versa the genes that are show close expression patterns could be regulated by the same set of transcription factors.

If we look closer at the regulatory regions of a known set of co-expressed genes in a particular tissue, will it give a rule for how the architecture(the min or maximum number of binding sites, spacing of these binding sites, orientation of these binding sites etc.) of such regulatory regions look like and explain something about their evolution ?

This is exactly what the authors have done in this paper in science(subscription required). They have used the 19 genes that are co-expressed in muscle cells of developing urochordate Ciona embryo. Of these 19 genes, 17 function in the same macromolecular complex, underscoring the requirement for tight coexpression. These 19 genes include six single-copy loci (sequences in a genome that do not share homology with any other sequences in the same genome). Seven genes are composed of two or three members(paralogs) of multicopy gene families. We also know that genes that are expressed in Ciona are predominantly regulated by three different binding elements in their regulatory regions. These elements are 1) cAMP response element called CRE 2)MyoD motif 3) Tbx6 motif. These elements can be described in terms of DNA sequence bases they are composed of.

The authors study the distribution, composition and strength of these motifs in the upstream regulatory regions of the 19 genes. They found that there was high degree of heterogenity in these regulatory genes. There was no common feature they could discern from all of these 19 loci. So how to account for the co-exp of these genes, the authors show that it is done by conserving locus specific distribution of these features. This can be see more clearly in the following picture (B).

(B) Distribution of cis-regulatory function at the 19 loci of this study. Cs, Ciona. savignyi; Ci, Ciona. intestinalis. Labels below axes indicate distance to transcription start site. Area of circle is proportional to estimated motif activity. Motifs are depicted as circles, and color indicates motif type: CRE (red), MyoD (green), and Tbx6 (blue).

We do not see any commonality in the locus, but we see that the architecture of the regulatory regions are conserved in the specific locus, for example the Ck.ci(creatine kinase gene from Ciona intesinalis) and Ck.cs (from Ciona savignyi) have the same distribution of the motifs. This locus specific conservation the authors saw only in the six single copy genes. There was a higher degree of heterogenity in the paralogous cluster of genes in terms of both sequence and functional turn over.

Thus the authors conclude “Thus, the syntactical rules governing this regulatory function are flexible but become highly constrained evolutionarily once they are established in a particular element.”
Brown, C.D., Johnson, D.S., Sidow, A. (2007). Functional Architecture and Evolution of Transcriptional Elements That Drive Gene Coexpression. Science, 317(5844), 1557-1560. DOI: 10.1126/science.1145893

Epistasis

ResearchBlogging.org
I learnt about epistasis in twelfth year of schooling. It was first used by Bateson to describe the masking of one allele(variant of a gene) at a locus masking another allele at a different locus. But today I see this word used in different contexts and I was really confused about its meaning, so looked on the net to find this paper describe wonderfully what I was looking for.
Cordell, H.J. (2002). Epistasis: what it means, what it doesn’t mean, and statistical methods to detect it in humans. Human Molecular Genetics, 11(20), 2463-2468. DOI: 10.1093/hmg/11.20.2463

PCR animation

I  found a nice detailed animation describing the PCR  reaction.

ResearchBlogging.org
Just when I was about to blog on this paper in cell by Asako Sakaue-Sawano, Hiroshi Kurokawa et al. I found that it was already beautifully blogged by “pure pendantry“. It is another example of imaging live cells with tagged proteins. I found the picture titled “A Survey of the Cell Cycle in the Developing Mouse Head” absolutely fascinating.

SAKAUESAWANO, A. (2008). Visualizing Spatiotemporal Dynamics of Multicellular Cell-Cycle Progression. Cell, 132(3), 487-498. DOI: 10.1016/j.cell.2007.12.033

Animals and plants compared

We have a nice comparison article at pharyngula on  animal and plant  development and how we are related.

The first blog I read today and inspired me to get to work early :).

ResearchBlogging.org
Last week I blogged on the talk by Peter Fraser where he showed evidence for the existence of transcription factories. He showed pictures as follows to demonstrate the theory of transcription factory. transcription factory

Fig. 1. Transcription factories are concentrated foci of active RNA polymerase. Immuno-detection of the hyper-phosphorylated form of RNAPII reveals their focal existence in a limiting number of transcription factories. Shown is a deconvoluted, single optical section of a mouse E12.5 fetal liver nucleus. Scale bar, 5 μm. Image courtesy of L. Chakalova. (taken from Seminars in Cell & Developmental Biology).

A new paper in molecular cell has appeared where the authors show evidence for the classical view that Pol II can be recruited to gene loci for activated transcription in living cells. They show this in polytene nuclei in salivary glands of Drosophila. Chromosomal DNA at loci containing the HS(heat shock) protein genes locally decondenses upon HS to form “puffs,” as can be readily observed in fixed, spread polytene chromosomes. Accompanying this decondensation is the strong recruitment of Pol II molecules that become densely packed along the activated transcription units. This is clearly demonstrated by this movie in live cells. Here is a picture which shows the transcription in the polytene chromosomes. The green color shows the presence of active transcription units where RNA pol II(which is ligated to enhaced Green flourscent protein) has been recruited.

polytene chromosome

Figure 1. Recruitment of Pol II to Major HS Puffs at 87A and 87C Observed in Living Cells

(A and B) Two-photon optical sections of a polytene nucleus expressing Rpb3-EGFP under NHS and HS conditions. (A) NHS: yellow arrows indicate Pol II-enriched sites that are transcriptionally active during normal development. (B) HS: red arrows show newly formed Pol II-concentrated sites upon HS.

(C) Recruitment of Pol II to 87A and 87C after HS. Times after HS are shown in minutes.

(D–F) Three sections of the same polytene nucleus under HS show distinct Pol II enriched sites (green). Chromosomes are stained with Hoechst33342 (red). 87A and 87C sites are indicated by the white arrows in (F) (Yao et al., 2006).

(G) A maximum intensity projection image (shown in pseudocolor) of all optical section series of this nucleus expressing EGFP-Rpb3 under HS (D–F). Scale bars, 10 μm.

Next the authors also have performed the dual-color FISH analyses on HS genes(figure 3). Labeled bacterial artificial chromosomes (BACs) containing HS genes were used to probe the interphase, diploid nuclei in larval imaginal disc tissues (Figure 3A). It is well known that HS genes are robustly activated in all larval tissues after HS, and therefore DNA-FISH signal during HS can represent active gene loci. The FISH signal indicates that HS genes occupy spatially distinct domains in most cases. Two Hsp70 loci 87A and 87C that are cytogenetically very close (separated by one subdivision not, vert, similar400 kb) also show distinct FISH signal. From these results, the authors conclude that, in diploid cells, HS genes colocalize at a very low frequency, and therefore, these coregulated genes are not generally cotranscribed within shared transcription factories during activation.no colocalization

Figure 3. Intranuclear Positions of HS Gene Loci in Drosophila Imaginal Disc Diploid Nuclei

(A) A FISH image of imaginal disc nuclei (red, small hsp locus 67B; green, Hsp70 locus 87A). Scale bar, 5 μm.

(B) FISH images on HS genes before and after HS (87C, Hsp70 locus; 63B, hsp83 locus).

(C) Summary of FISH analyses on HS gene pairs before and after HS.

(D) Positions of 87A, 67B, and 63B loci relative to the nuclear periphery or interior regions.

It is real exciting and waiting game to see which of the two theories are going to fail: Is transcription factory a distinct sub-nuclear compartment or the classical view of RNA pol II recruited to the gene loci !!

.